After the weather prospects, traffic will probably be of most concern for people hoping to see the total solar eclipse on August 21, 2017. As with all solar eclipses that sweep through populated areas, there is often traffic congestion. As the date draws ever closer, the media (including social media) will burst in to life creating a spike of interest in the event. Many Americans may not have planned ahead and decide to get out on the roads, freeways and interstates to attempt to get in to the 70 mile wide path of totality where they can witness this beautiful, once-in-a-lifetime experience. To help people make better plans, below are some very useful charts and statistics related to travel times, estimated visitors and traffic during the event.
Drive times to the centreline
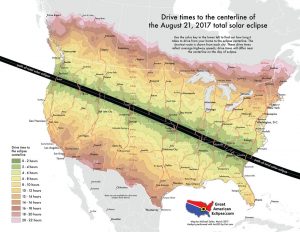
The map below illustrates estimated drive times extending outward from the centreline of totality. This brilliant map provided courtesy of Michael Zeiler, reflects average highway speeds across the USA. Click to enlarge.

Driveshed map of the solar eclipse
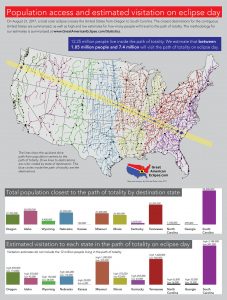
Another map by Michael Zeiler this time illustrating where cars can drive the quickest route to destinations in the path of totality. It features drive paths from every county in the USA. Click to enlarge

Which state will have the most visitors?
Despite unfavourable average weather conditions, according to studies, South Carolina is estimated to have the largest number of visitors. This is predicted to be from between 500,000 and 2.2 million visitors. Tennessee comes in second with an estimated visitation population between 360,000 to 1.4 million.
